
What Kenya’s 6.8% Inflation Means for Food, Transport and Household Budgets
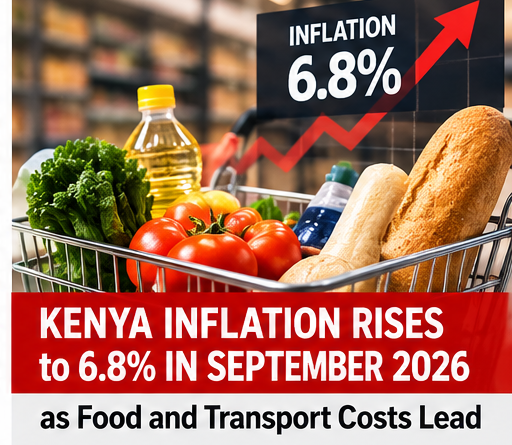
Kenya’s annual inflation rate was 6.8% in September 2026, but that figure does not mean every household’s bills rose by 6.8%. It compares the national consumer-price basket with September 2025. Over the shorter period from August to September, the overall index rose by 0.4%, according to the Kenya National Bureau of Statistics (KNBS).
What drove the annual rate?
KNBS reported annual price increases of 9.5% for food and non-alcoholic beverages, 15.6% for transport, and 3.2% for housing, water, electricity, gas and other fuels. Together, those three divisions make up more than 57% of the CPI basket’s total weight. The national rate is therefore strongly influenced by costs that many households encounter, but each family’s experience depends on its own purchases.
September prices did not all move in the same direction
The KNBS report compares national average retail prices in August and September. In that month, a 2-kilogram packet of white wheat flour rose 4.5%, fresh packeted cow milk rose 6.0%, and fresh unpacked cow milk or cream rose 5.8%. Tomatoes fell 4.1%, loose maize flour fell 1.9%, and sugar fell 0.4%.
Transport showed the same difference between a longer and shorter comparison. Annual transport inflation was 15.6%, but inter-town bus and matatu fares fell 1.0% between August and September, and city fares fell 0.3%. International airfares rose 8.1% in that month. A high annual rate can therefore coexist with a monthly fall in some prices.
These are national averages from KNBS’s survey, not a guarantee of the price at a particular shop, market or matatu stage. Prices can differ by town, outlet, brand and package size.
How to use the figures in your household budget
For a practical comparison, choose a few items or expenses your household buys regularly and record the quantity, shop or market, and amount paid each month. Compare the same item and package size over time. This helps distinguish a change affecting your own budget from the national average, and it avoids assuming that an item’s price moved in line with the headline rate.
- Separate annual changes from month-to-month changes when reading a price report.
- Compare like for like: the same quantity, grade, package and location.
- Review recurring costs such as food, fare, cooking fuel and electricity in your own records.
- Use the CPI to understand broad trends; it is not a forecast of next month’s prices.
Why your personal inflation can differ
KNBS measures price changes in a weighted basket of goods and services using price data collected from a statistically representative sample of outlets in 50 urban data-collection zones. The weighting reflects how households generally spend across categories. A household that spends a larger share on transport or food can feel a different change from a household with a different spending pattern.
For the headline September release and official data, see the KNBS September CPI report. For the detailed October 7 policy-rate decision, see our separate September inflation news update.
Source
Kenya National Bureau of Statistics: Consumer Price Indices and Inflation Rates, September 2026.
Price movements in this explainer refer to the August-to-September comparison unless marked as annual. The latest data cited here is for September 2026.
